Saturday, December 24, 2005
Friday, December 23, 2005
- Kadis: ontology document and database for two dataset;
- Join component: going over the old work and adding new functions.
Thursday, December 15, 2005
- Sarver, ashen, leans against a wall.
- As he sits on the military plane that will take him home, the Bronze Star he’s been awarded is stowed away with the rest of his gear.
- Staff Sergeant Jeffrey S. Sarver is at home in the nation he has sworn to protect—and a long way from the loneliest spot on earth.
- Many settled in the barrios of Los Angeles, where they were preyed upon by the city’s turf-conscious Mexican
- .....says the gang has steadily encroached on the neighborhood
- Young kids see the gang members as role models
- In exchange for leniency, Paz gave prosecutors firsthand information about armed robberies, stabbings and shootings stretching from California to Texas to North Carolina.
- But the strictures and the isolation became too much for Paz.
- When it was over, she felt like she finally belonged.
- It turns into a driveway up the block and comes back, prowling slowly, watching her.
Wednesday, December 14, 2005
- A bad beginning makes a bad ending.
- A bad thing never dies.
- A bad workman always blames his tools.
- A bird in the hand is worth than two in the bush.
- A boaster and a liar are cousins-german.
- A bully is always a coward.
- A burden of one's choice is not felt.
- A candle lights others and consumes itself.
- A cat has 9 lives.
- A cat may look at a king.
Studying English - from Reader's Digest
- Now, at the Baghdad intersection, Sarver’s team kneel in the dirt, and, like squires attending a knight, adjust his armor.
- At 10 feet out, the point of no return, he gets the adrenaline surge he calls The Morbid Thrill.
- “It’s a numbing, sobering time, it’s the loneliest spot on earth.”
- As the Humvee rattles down the road, Sarver, lost in thought, stares out the window at the blazing Iraqi sunset. I like what I do, he thinks to himself.
- Soon it will be dark, curfew time.
- With a glance he could suss out any bomb’s architecture.
- making him one of ten Army bomb techs to die in the field as of November 2005.
- when fatigue, distraction and homesickness can dull a soldier’s instincts.
- “When you’re 10 feet away from it,” he says, “you get comfortable because you’re at the point of no return.”
Wednesday, November 16, 2005
The basic phase of the demo of KADIS
In the first step, there are five different selections for the query for the moment. All of these selections should present with a concept at the ontological level. That means, it should not have much to do with the detail of each dataset. Because different reseachers might use different ways to describe the same concept, it's hard for one user to understand others' notes for one concept without detailed explanation. We plan use XML files to organize all ontological information about the datasets concerned. (Note: the ontological information is kind of representation of concept which can be understood by most people in the field of archaeology.
- Dataset selection: all datasets existing in the collections are displayed in a checkbox list.
- Taxonomic level: a treeview plus checkbox is used to display the hierarchical structure of the taxonomic categories.
- FUI selection: it is connected with the selections made in 2.
- Element selection: a list box may be used to display all elements in the datasets.
Design for KADIS demo
So it's composed of two phases corresponding to the two focuses: the basic phase and the conflict-resolving phase.
- Basic phase: At the point of a user, s/he makes a series of selections for the query, and then gets the result with some kind of format (e.g., txt, excel files etc.). Standing on the side of the system (or web application), it displays the necessary information about the query to the user (such as the datasets) with a friendly way, and outputs the results according to the user's requirements.
- Conflict-resolving phase: when a new dataset is integrated into the existing database, some conflicts may happen for the different definitions used by the different reseachers. While a query is processed, it's the user who should provide its resolutions to the concerned conflicts in order to produce the right result. It's an interactive procedure.
In the implementation, we use classical client-server architecture. The basic idea is as the following: the archaeological datasets are stored in the serve. We use MySql database to store all of data for the moment. The ontological information about the datasets is organized with an XML format, in owl or xml files. When the user logs the website and starts to select, the client on the user's side will fetch relevant information from the server (one possible way is to read data from the XML or mysql database, generate suitable html pages and send them back to the client browers) .
Friday, October 21, 2005
About MDS (Multi-Dimensional Scaling) algorithm


We use MDS to map the original space into a new low-dimensional space. But when new dimension is introduced into the original space, the resulting new low-dimensional space may change a lot. See the figures above. The first one is the plot depicting the first 20 entries in a blog. The second depicts the first 28 entries. Even though the difference between them should be small, the resulting plots are very different.
The MDS analyzes the data set as a whole, and it's impossible to make a prediction only based on the information about the past. That might be a problem.
Man-made topic interrupted patterns
- The first step is to identify some rather long dominated or drifting patterns in the original sequence.
- Add some noises into these patterns.
It's relatively easy to find some dominated or drifting patterns in the seuqnce of entries. We should firstly prepare a suitable dataset which contains some patterns we want.
But for the second step, it seems not so simple. Noise is the important issue that we need consider.
What is the noise? There are at least two choices. One is that we introduce new entry from other irrelevant blogs. The other is just to adjust the original sequence so that some entry suddenly happens where it should not be.
- The introduction of new element in the entries space, will lead to the modification of new space generated by means of MDS. Thus, the original patterns can not be maintained. The result is unexpected.
- Just adjusting the order of the original sequence won't change the existing patterns, and it's safe.
So I believe the second choice is better.
Another issue that needs noting is about the curve segmentation algorithm. When we changes the order of entries in the sequence, patterns might change too for the curve segmentation algorithm. That means, even though we use the second selection to generate the interrupted patterns, it's not safe enough: the original patterns may be changed, so that the interrupted pattern can not happen as expected. See figures below.


We move point N0.19 into the position between No.10 and No.11 and get the figure above. The adjustation changes the original pattern so much that the dominated segment #8 to #10 doesn't exist any longer. I believe that it's due to the value of #11 is so close to the original segment.


In the last figure, we move both #19 and #20 to the place between #10 and #11 in the original (first) figure. In result, we get an interrupted pattern too.
Tuesday, October 18, 2005
Study of the interrupted pattern
We need produce some "interrupted" patterns purposely, and find a good way to represent them with some kinds of fomular. But it should be noted that how much this 'man-made' patterns reflect the real world! It's another problem.
Monday, October 10, 2005
Reconsideration of the application of curve segmentation aglorithm in our approach
A new way to find the boundaris among topic segments
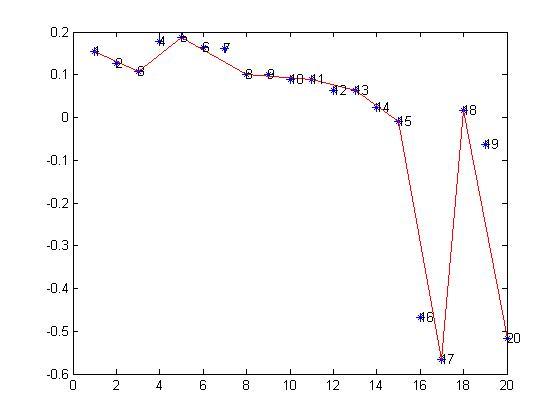
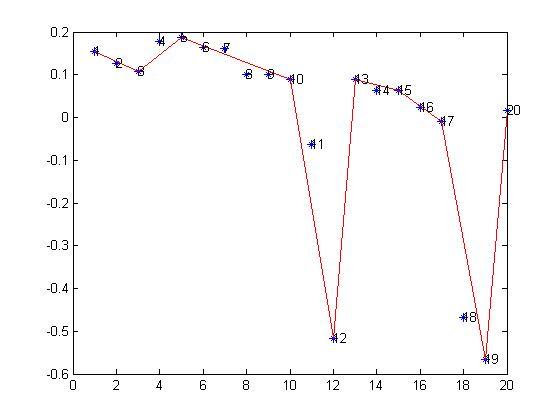
When I used a small threshold value for the 'dominated/dominant' pattern, the patterns of results construct an irregular sequence, that is, the 'dominated/dominant' patterns and the 'drifting' patterns interleave in a random manner. If I followed my previous scheme to get the boundaries in the squence, I have to analyze each segment one by one. But when I increased the value of threshold, some interesting changes happen. Some 'dominant/dominated' patterns come out in a consecutive way, that means, they could be combined together. According to the plot for all entries, it looks impossible or meaningless to be classified them to be 'dominated/dominant' patterns, whick LOOK obviously kind of 'drifting' pattern. But the result is so regular that it could produce much better boundaries if we combine the consecutive segments together. It is time to split the pattern analysis and the plot, although not so completely.
If the new approach to decide boundaries are proved useful, we can get at least two benefits. On one hand, the combined 'dominated/dominant' pattern topic segments make it possible to construct a hierarchical structure about the content of entries, although it might not be realistic for the moment. On the other hand, according to current results, the combination of topic segments could make improvement on the segmentation of topic segments. Furturemore, it could identify the main tendency of entries, i.e., the general topic development patterns in the entries.
By the way, this result made me reconsider the role of plots we got from the curve segmentation. We draw the curve in a two-dimensional plane, but the two dimensions are different in terms of scales. The X axis describes the sequence number of entries, which is measured by discreted numbers. Whereas the Y axis records the value of each entry, the value is kind of measure of 'content' in each entry. When we use curve segmentation algorithm to approximate the entries in the plane, we treat the two dimensions equally without considering their difference, but we should do so. :(
Some questions need considering
- The reason that we use curve segmentation;
- Do we use curve segmentation algorithm in a correct way!?
- The relationship of our approach to achieve topic segments especially the topic development patterns from the construction of hierarchical structure of weblog.
- A reasonable method to decide the boundaries among segments.
- How to select the suitable thresholds for the experiment and why.
- In the experiment, a good dataset should be used which is able to cover most possible cases in our approach.
Saturday, October 08, 2005
Choose a good dataset to make the experiment of topic segmentation of Weblog
:)
Friday, October 07, 2005
Comparison of different increasing rate
Thursday, October 06, 2005
The determination of boundaries among topic segments
- if the segment currently concerned is a dominated/dominant pattern, all of points in the segment can not be taken as the starting point of other segments.
- if there are not only one points in the segment line, the boundary might be the starting point when there are no any segments before it. Or else, the point next to the starting point of the segment is taken as the boundary.
- if there are only two nodes in the segment which are end points of the line. The peak point would be a boundary which is also the single point segment. The point next to the peak would be the boundary for the following topic segment.
The definition of topic segments

Steps to get the topic segments and patterns
- Curve Segmentation Algorithm on the plot of all entries concerned.
- Combining lines with similar behavior.
- Identify topic segments.
- Classify topic segments based on the development pattern insides.
If necessary, the step 2 to step 4 could be used on the result in an iterated way, until no changes happen any longer.
We exploit a curve segmentation algorithm from Lowe in the first step to obtain a series of lines approximating the original points.
In the second step, we decide whether to combine two consecutive curve segments (i.e., lines) through making a comparison of slopes and average variances between them. The key point is the combined lines should have similar slope and average variance. How to define the 'similarity'? We decide to use increasing rate to calculate the difference between two consecutive lines. We believe the approach with rate will be better than absolute value for its indenpendance of the specific application.
Because I just redefine the topic semgents (might be a point, a line or a series of lines), I must give more details about that and plan a new experiment to prove it.
In fact, we can classify each topic segments at the step three. When a point is a topic segment, it belongs to 'dominated/dominant' pattern. When the topic segment is composed of one line, it would be 'drifting' or 'dominated/dominant' pattern. When a topic segment is made up of not only one lines, it's probably 'interrupted' pattern. For the topic segments of 'interrupted' pattern, we use one line over its components to replace original lines. Such a replacement will possibly change the development patterns around, leading to a new iteration from step 2 to step 4.
Another idea about how to decide the boundaries of topics

1. In the case (a), the line composed of p1 and p2 is a 'dominant' pattern segment whereas that of p2 and p3 is a 'drifting' pattern segment. The boundary between the two consecutive segments should be 'p2' which is located in the middle. But 'p2' represents a page whose value is similar to p1 instead of p3, so that p2 should belong to the segment starting at p1. Thus, the boundary should be p3. The same principle is used to the case (b), where the boundary should be p4 instead of p3.
2. As far as the case (c) and (d) are concerned, both of them are composed of drifting segments. The point in the middle (or in the peak) looks a good candidate for the boundary of topic patterns. But be carefully here, we have to reconsider the definition of topic segments!
Before, I didn't carefully tell the difference between topic segments and curve segments. Now it's just time. Curve segments are simple to define. They are just lines, more accurately, they are components composing into a curve. Each pair of consecutive lines shares the same connection point. Topic segments are a bit complex. A topic segment should be a page or a series of pages in A line. That is, a topic segment is a point, a line or some consecutive lines, but a line may not necessarily be a topic segment. So when deciding the boundaries of topics, we need consider more than shared points among lines.